Welcome to coveredcallETFs.com. CoveredcallETFs.com is built to be a gateway that offers an introduction to Covered Call ETFs, how they work and which benefits they offer. ETFs are a relatively new type of investment that gives you the chance to use investment strategies previously only available to big hedge funds and investment banks due to the high cost associated with replicating these strategies. ETFs are now available to regular investors in the United States and Canada as well as a number of other countries. This offers small retail and institutional investors the chance to earn a good return on invested capital in slow-moving or falling markets.
Here are some of the questions we answer on this website:
Whether you should sell your ETFs or borrow money for the down payment of a house. Where to check the interest rates in local markets such as the UK and Sweden.
If Covered call ETF:s are a good investment in your country. Local laws and tax regulations can have a huge impact on which investments you should make. An investment that is good if you live in Sweden or the UK can be horrible if you live in the US.
What is an ETF (Exchange-Traded Fund)?
If you’re new to investing, you’ve probably heard the term ETF thrown around a lot. ETFs are one of those financial tools that sound way more complicated than they really are. So let’s break it down in plain English.
The acronym ETF stands for Exchange-Traded Fund. It is very similar to a mutual fund, but the fund shares are listed on an exchange and traded in a manner very similar to stock trading. While shares of a standard mutual fund are normally only bought and sold once a day, the shares of an ETF are bought and sold continuously throughout the trading day. That means you can buy or sell shares in an ETF throughout the day using a regular brokerage account.
A mutual fund or exchange-traded fund is essentially a bundle of investments. Instead of you picking individual assets (eg. stocks) you buy shares in a fund. The fund takes the money from all the share owners and use it to invest. A big advantage with using funds is that you get instant diversification. Example: Let’s say you want to invest in tech companies. You could buy shares of Apple, Amazon, Microsoft, Google, and so on—one company for each purchase. But that’s time-consuming and pricey. Instead, you can buy shares in a tech-focused mutual fund or ETF, which already owns shares in all those companies.
This gives you diversification, which is a fancy way of saying you’re not putting all your eggs in one basket. If one company stumbles, the others can help balance it out. It’s less risky than betting everything on one stock. For a new investor with a small budget, achieving a proper degree of diversification buy investing in individual assets can be difficult. With mutual funds and ETFs, you can invest a small amount of money and get instant diversification.
Key Features of ETFs
Diversification: ETFs often track an index, such as the S&P 500 or NASDAQ-100, meaning when you buy shares of an ETF, you’re investing in a wide range of companies or assets. This diversification helps spread risk, as you’re not relying on the performance of a single stock or bond.
Trading Like a Stock: ETFs are bought and sold on stock exchanges throughout the trading day, just like individual stocks. This means their price fluctuates based on market supply and demand, unlike mutual funds, which are priced once daily after markets close.
Low Fees: ETFs tend to have lower expense ratios compared to mutual funds. Since many ETFs are passively managed (they simply track an index rather than relying on a fund manager to pick stocks), their operating costs are usually lower. Actively managed ETFs, however, tend to have higher fees.
Liquidity: Because ETFs are traded on exchanges, they are generally considered to be liquid, meaning you can buy or sell them easily during market hours. However, liquidity can vary depending on the ETF’s volume and the assets it holds.
Transparency: Most ETFs disclose their holdings on a daily basis, giving investors clear insight into where their money is invested. This transparency is one of the features that sets ETFs apart from mutual funds, which may only disclose holdings quarterly.
ETFs Are Available For Many Different Niches
Whatever you’re into—or whatever financial strategy you want to follow—you can probably find an ETF that will at least be close to what you want.
Here are a few examples:
ETFs that are designed to follow a stock index, e.g. the &P 500.
ETFs that invest in companies in specific industries, e.g. tech, healthcare, or energy.
ETFs that invest in bonds, or a combination of stocks and bonds.
ETFs that invest in real estate.
ETFs that are designed to follow a commodity price, or a basket of commodities.
ETFs that invest in specific geographical markets, e.g. South East Asia.
ETFs that invest in something very specific, e.g. renewable energy, gaming companies, or AI companies.
ETFs vs. Mutual Funds: What’s the Difference?
Both ETFs and mutual funds are collections of investments, but they work differently. ETFs trade like stocks, meaning you can buy and sell them any time during market hours. Mutual funds, on the other hand, only trade once per day, after the market closes.
ETFs usually have lower fees and more flexibility. That’s why they’re especially popular among beginner investors and people using DIY platforms like Robinhood, Fidelity, or Vanguard.
Why People Like ETFs
Low cost: Most ETFs have lower fees than mutual funds.
Easy access: You can invest in an entire market or sector in one move.(This is also possible with mutual funds.)
Transparency: You can usually see exactly what the ETF holds.
Flexibility: Buy or sell anytime during the trading day, just like a stock.
Good for beginners: You don’t need to be a stock-picking genius to get started.(This is also true for mutual funds.)
Diversification: Even if you only have a small amount of money to invest, you can achieve a high degree of diversification. (This is also true for mutual funds.)
How ETFs Work: Simple Mechanics Behind the Scenes
ETFs might look like mutual funds on the surface—they both let you invest in a collection of assets—but ETFs come with one major difference: they trade on stock exchanges in real time. That means you can buy and sell them just like regular stocks, whenever the market is open.
Here’s what that actually means in practice:
Real-Time Price Changes
With mutual funds, the price (called the NAV, or Net Asset Value) is set once per day after the market closes. So if you place an order at noon, you won’t know the exact price until later that evening. ETFs don’t work like that. Their prices move throughout the trading day—just like Apple, Tesla, or any other stock. If demand goes up, the price goes up. If there’s a sell-off, the price drops. You can watch the ticker change by the minute, which is great for people who like to keep an eye on market timing.
They Trade Like Stocks—With All the Tools That Come With It
ETFs are super accessible. You can buy them on just about any trading platform—Robinhood, Fidelity, E*TRADE, Charles Schwab, Vanguard, and more. If you have a brokerage account, you’re good to go. When you place an order, it goes through like any other stock. You can buy one fund share, ten, or even fractional fund shares depending on the platform.
Since ETFs behave like stocks, you can do a lot more than just buy and hold:
Set a limit order to buy only at a certain price
Use stop-loss orders to sell if the price dips below a set level
Short an ETF (if you think it’ll drop in value)
Hold long-term as a stable part of your investment strategy
Some investors trade ETFs daily. On the other end of the spectrum, we find the investors who buy ETF shares and hold on to them for years. How you use and ETF depends on your goals—but the flexibility is there.
In short, ETFs give you mutual fund-level diversity with stock-level control. You get access to a basket of investments, but with way more freedom in how you buy and sell the fund shares.
What is a covered call ETF?
An ETF is a type of fund that owns a specific type of assets. SPY is the worlds largest ETF. The fund buys the 500 stocks listed on the S&P500 index. The funds results mirror that of S&P500.
A covered call ETF works in a similar way but put out Call options to increase the yield the fund gets each year. This increase the yield the fund gets when the market is going down or stands still but limits the upside in a bull market.
Lets look at a possible example: An ETF fund buys 100 shares of Microsoft stock. These shares provide a dividend yield of 3.2%. A Covered Call ETF would increase this yield by putting out a sell option on these 100 shares. They then sell this call option for 1% of the share value. (The exact price they get for their call options can vary). This allows them to increase the yield from 3.2% to 4.2% completely risk-free.
The only downside is if the stock quickly increases in value during the maturity of the option. In this situation, the ETF will be forced to sell their shares for a price below market value when the option is exercised. This limits the upside. The ETF will still make money but not as much as it would have made if they hadn’t put out the call option.
This makes the Covered Call ETFs an investment that is suitable for most market conditions except for bull markets where a covered call ETF might produce a lower return than regular ETFs and other funds.
Covered call ETFs will in other words offer:
Limited upside
Higher income.
Types of ETFs
ETFs come in many different shapes and sizes. Some are broad and low-risk, others are niche and bold—but they all give you access to groups of investments in a single trade. Whether you’re building a long-term portfolio or trying to bet on a trend, there’s probably an ETF for it.
Here’s a look at some of the most popular types of ETFs and what they’re built for.
Index ETFs
These are the classic, most common ETFs out there. They track market indices like the S&P 500, FTSE100, or Dow Jones (DJIA). The goal here isn’t to beat the market—it’s to track the market. If you want simple, steady exposure to a wide range of top-performing companies, index ETFs can be a great choice. This is where a lot of beginners start.
Example: SPDR S&P 500 ETF Trust is one of the most popular ETFs and it tracks the S&P 500. When you buy it, you’re essentially betting on the performance of 500 of the biggest companies in the U.S.
Sector ETFs
If you believe a specific industry is about to take off—or want to balance your portfolio with exposure to certain sectors—these are the way to go. Sector ETFs let you invest in focused areas like tech, healthcare, finance, or energy without needing to pick individual companies.
Example: XLK targets tech stocks like Apple, Microsoft, and Nvidia. XLF covers financial giants like JPMorgan and Bank of America.
Bond ETFs
These ETFs make it easy to invest in fixed-income assets like government bonds or corporate bonds. Normally, buying individual bonds takes a lot of research (and sometimes high minimums). Bond ETFs simplify all of that by pooling a range of bonds into one place.
Some of the largest and most well-known bond ETFs track the Bloomberg U.S. Aggregate Bond Index, and index commonly known simply as “the Agg”. The Agg is comprised of over 10,000 United States-issued fixed-income securities, e.g. Treasury bonds, mortgage-backed securities (MBS), and investment-grade corporate debt. ETFs tracking the Agg are often used to add stability and income to a portfolio, especially during market volatility.
Examples: Two of the largest ETFs tracking the Agg are the iShares Core U.S. Aggregate Bond ETF (ticker: AGG) or the Vanguard Total Bond Market ETF (BND). At the time of writing, each of them hold around $125 billion in assets. They have comparatively low costs and are popular choices among investors looking for long-term stability and low fees.
Of course, bond-tracking ETFs does not have to be as “boring” as the Agg-tracking ones, and you can pick ETFs with a different approach if you want to spice things up and are willing to take on more risk. There are for instance ETFs that will invest in bonds issued by governments and/or corporations in emerging markets. Such bonds come with higher risks (including currency risk and political risk) and the interest rates will reflect this. Note: Many emerging-market bond ETFs mitigate the currency risk somewhat by hedging for currency fluctuations.
Other Debt ETFs
There are many ETFs that hold investment-grade bonds, but you can also go for ETFs that invest in other types of debt. There are for instance ETFs that invest in floating-rate loans issued to companies with below-investment-grade credit ratings. Typically, this will involve senior loans, which are secured by the borrower’s assets and rank higher than most other credits if there is an insolvency.
A fairly new invention are the ETFs that offer exposure to private credit through publicly traded vehicles such as business development companies (BDCs) and collateralized loan obligations (CLOs). They can be very high yield, but are of course also high risk. Previously, investing in this type of debt was out of reach for the average retail investor, but through an ETF you do not need to be an institution or high-net-worth individual to get exposure.
Thematic or Niche ETFs
These are for investors who want to lean into specific trends or ideas—whether it’s emerging technology, renewable energy, cannabis, or space exploration. Thematic ETFs are often built around concepts or industries that are comparatively small today but are expected to grow at lot. They’re more volatile, but they also come with the potential for big returns if the trend plays out.
Example: BOTZ focuses on robotics and AI companies. TAN is built around solar energy firms.
If you want to learn more, a good place to start is The Global Industry Classification Standard (GICS, which sorts companies into 11 different core sectors, and then further breaks those down into 24 industry groups, 69 industries, and 158 sub-industries. If you want to be specific when you invest in thematic ETFs, having a good understanding of the GICS can be a useful tool in your toolbox.
A type of ETF that has grown very popular in the last few years is the one that invest in the semiconductor industry, and the GICS has been helpful in clarifying for investors why they should take a closer look at this niche. Within the core sector Tech, the GICS identifies three primary industry groups: Software and Services, Technology Hardware and Equipment, and Semiconductors and Semiconductor Equipment. Semiconductors and Semiconductor Equipment is important and distinct enough to warrant a separate group, instead of being clumped together with other hardware. As you probably know already, semiconductors are utilized to control electrical signals in a wide range of devices, and lot of our everyday technology rely on them – including computers. In 2014-2024, the S&P Semiconductors Select Industry Index delivered an annualized return above 17%, which meant that it outpaced both the S&P Tech Hardware Index and the S&P Software & Services Index.
Examples of semiconductor ETFs:
Invesco PHLX Semiconductor ETF (SOXQ) Expense ratio 0.19%
SOXQ tracks the PHLX Semiconductor Sector Index, a benchmark that has been around since 1993. With an expense ratio of just 0.19%, SOXQ has become popular among long-term investors who wish to keep the costs down. The historical performance of SOXQ has been similar to that of VanEck Semiconductor ETF (SMH) and iShares Semiconductor ETF (SOXX), and there are big portfolio overlaps between these three ETFs.
VanEck Semiconductor ETF (SMH) Expense ratio 0.35%
VanEck Fabless Semiconductor ETF (SMHX) Expense ratio 0.35%
iShares Semiconductor ETF (SOXX) Expense ratio 0.35% SOXX tracks the NYSE Semiconductor Index. An options chain is available for investors who wish to buy or sell calls and puts. Note: There is a lot of exposure overlap between SOXX and SMH, but SOXX underweights NVDA and TSM.
SPDR S&P Semiconductor ETF (XSD) Expense ratio 0.35% XSD can be a good choice if you want exposure to up-and-coming companies instead of focusing on well-established giants. The XSD tracks the S&P Semiconductor Select Industry Index, and since this index is equal weighted, a smaller semiconductor firm that just made it into the index will have the same weighting as a giant whenever he index re-balances.
First Trust Nasdaq Semiconductor ETF (FTXL) Expense ratio 0.60%
Direxion Daily Semiconductor Bull 3x Shares (SOXL) Expense ratio 0.75% SOXL is a popular choice among day traders and swing traders, who are less concerned with the 0.75% expense ratio than buy-and-hold investors. SOXL does not prioritize low cost and high diversification – it is an ETF that brings the volatility sought after by short-term traders, and this has translated into high liquidity which is also what short-term traders need. SOXL is a so-called leveraged ETF, which uses derivatives to outperform an index. The goal for SOXL is to deliver a daily return of three times that of the NYSE Semiconductor Index, and the managers of SOXL are using index swaps to achieve this
International ETFs
Since a lot of the mainstream ETFs are heavily focused on the U.S. market, international ETFs have evolved to cater to investors who want exposure to other countries and regions around the globe.
International ETFs can give you exposure to different countries or regions without you needing to research individual foreign companies. Some are region-based (like Europe or Asia), while others are targeting specific emerging markets.
In this context, international simply tends to mean “not focused on the U.S.”, since the U.S. market is so dominant in the world of ETFs.
Example: EEM invests in emerging markets like China, Brazil, and India. VEU holds a mix of global stocks but leaves out U.S. companies.
Dividend ETFs
These ETFs focus on companies that regularly pay out dividends. They’re a solid choice for investors who want to generate consistent income—whether that’s to reinvest or help fund retirement. If stocks owned by the ETF pay dividends, the money is passed along to the investors. Most EFTs pay out the money quarterly on a pro-rata basis (how much you get depends on how many fund shares you own).
Example: VIG includes companies with a track record of growing their dividends over time. SCHD focuses on high-yield dividend stocks with strong fundamentals.
Benefits of ETFs: Why So Many Investors Choose Them
Pros and Cons of ETFs
Benefits of ETFs
Low Costs: Most ETFs, especially those that are passively managed, have lower fees than actively managed mutual funds.
Flexibility: ETFs can be traded throughout the day, allowing investors to react quickly to market conditions.
Tax Efficiency: ETFs are generally more tax-efficient than mutual funds because they don’t distribute capital gains to investors as frequently.
Accessibility: ETFs can be bought and sold through regular brokerage accounts, and you can invest in them with relatively small amounts of money, which makes them accessible to a wide range of investors.
ETFs have exploded in popularity over the last couple of decades—and it’s not just hype. They offer a smart, flexible, and cost-effective way to invest, whether you’re a beginner building your first portfolio or a seasoned investor looking to streamline things. So what exactly makes ETFs such a go-to option?
Here’s a breakdown of the biggest benefits that keep people coming back.
Diversification Without the Hassle
One of the best things about ETFs is that you get access to a broad range of investments with just a single purchase. Instead of buying dozens of individual stocks or bonds, you can buy one ETF that holds them all. This spreads out your risk—if one company in the ETF takes a hit, the others can help balance it out. It’s a simple way to avoid putting all your eggs in one basket, even with a small investment.
Of course, this can also be achieved using normal mutual funds.
Lower Fees That Don’t Eat Your Returns Most (but not all) ETFs are passively managed, which means they track an index rather than relying on a team of managers to pick stocks. That translates into lower costs for you. Mutual funds often come with higher expense ratios and sometimes even front-loaded fees. ETFs usually keep those expenses to a minimum, letting more of your money stay invested and working for you. With that said, index-tracking passively managed mutual funds with low fees are also available; the ETF is not the only way to go if you want to keep fund management fees down.
Buy and Sell Anytime (Just Like a Stock)
Unlike mutual funds which only trade once a day after the market closes, ETFs can be bought or sold any time the market is open. Want to make a move at 10 a.m.? No problem. Need to sell before closing? Go ahead. This kind of flexibility is a huge plus for people who like having more control over their timing.
Daily Transparency
Most ETFs disclose exactly what they hold every single day. That means you’re never left guessing where your money is actually going. Mutual funds, on the other hand, typically report holdings quarterly, which makes ETFs the more transparent option by far.
More Tax-Friendly Than Mutual Funds in the United States Thanks to something called the “in-kind redemption process” (don’t worry, you don’t need to memorize that), ETFs are usually more tax-efficient than mutual funds in the United States. In simple terms, when investors sell out of an ETF, it doesn’t trigger capital gains taxes for everyone else. That’s not always the case with mutual funds, which can hit you with unexpected tax bills—even if you didn’t sell anything.
ETFs vs. Mutual Funds vs. Stocks: What’s the Difference?
When you’re figuring out where to put your money, it can be tough to choose between ETFs, mutual funds, and individual stocks. Each one works a little differently, and they all come with their own pros and cons. Here’s a quick side-by-side breakdown to help make sense of it all—so you can pick what fits your investing style best.
Diversification
If you’re looking to spread out risk, both ETFs and mutual funds are solid picks. They pool your money across dozens or even hundreds of companies or assets, which lowers your exposure to any single one falling apart. Individual stocks, on the other hand, leave you riding the wave of one company’s performance—great if it pops, not so great if it tanks.
Of course, you can achieve diversification in your own stock portfolio by being mindful when you pick the stocks. Many beginners, however, start out with a small amount of money, and simply investing in 50+ different companies at the same time is not really feasible, unless you buy fractional shares. For a novice investor with $100 a month to invest, putting the money into a well diversified mutual fund or ETF is an easy way to ensure a high degree of diversification from day 1.
Note: Even though mutual funds and ETFs can be highly diversified, it is actually a good idea to employ some diversification when it comes to funds as well. As your portfolio grows, consider investing in several different funds instead of putting all your money into the same one.
Fees
ETFs win here. If you want to keep the fund fees down, passively managed ETFs are usually a great choice, as their fees tend to be much lower than what you would by mutual funds.
Mutual funds are more likely to be actively managed, and they also tend to come with sales charges and various maintenance costs baked in, which can pile on the costs. With that said, some of the passively managed index-tracking mutual funds have really low fees.
Individual stocks don’t come with ongoing fees.
Trading
ETFs and individual stocks are both traded throughout the day on stock exchanges. You can buy and sell them whenever the market’s open. Mutual funds? Not so much. You can only trade them once per day, after the market closes, and you won’t know the price until then.
Minimum Investment
ETFs and stocks are very beginner-friendly when it comes to getting started. Many platforms let you buy fractional shares, so you can invest with as little as $5 or $10. Mutual funds often require a higher minimum investment—sometimes $500, $1,000, or even more—depending on the fund.
Some stocks are not possible to purchase on a small budget unless you purchase a fractional share. The most famous example is BRK.A (Berkshire Hathaway Inc.), which – at the time of writing – has a share price of 750,000 USD. NVR is trading just below 7,560 USD, BKNG at 4,435 USD, and AZO just above 3,700 USD.
Which One Should You Pick?
Go with ETFs if you want easy diversification, low fees, and the ability to trade throughout the day.
Choose mutual funds if you’re more hands-off. Many people who invest in mutual funds want actively managed funds and are willing to pay the cost.
Try individual stocks if you enjoy researching companies, taking bigger risks, and potentially earning higher rewards—but with more volatility.
You can also mix and match. Many investors use a core of ETFs for stability, add mutual funds for certain managed strategies, and sprinkle in a few individual stocks for fun or growth potential. There’s no one-size-fits-all—just what fits you.
Feature
ETF
Mutual Fund
Individual Stocks
Diversification
High
High
Low (unless you own many)
Management Fees
Low
Medium to High
None
Traded Like a Stock
Yes
No
Yes
Minimum Investment
Very Low
Often High
Varies
Risks of Investing in ETFs: What to Watch Out For
Drawbacks of ETFs
Trading Fees: While ETFs generally have lower expense ratios, you may still have to pay a commission each time you buy or sell ETF shares, depending on your broker. Some brokers offer commission-free ETFs.
Market Risk: Like any investment tied to stocks or bonds, ETFs are subject to market volatility. If the index or sector the ETF tracks performs poorly, your investment will lose value.
Tracking Error: In some cases, an ETF may not perfectly match the performance of the index or assets it aims to replicate. This is known as tracking error.
ETFs are often praised for being easy, affordable, and beginner-friendly—but let’s not pretend they’re perfect. Like any investment, ETFs come with risks. Some are obvious, others sneak up on you if you’re not paying attention. Whether you’re new to the market or just building a more hands-on portfolio, it’s important to know what could go wrong before jumping in.
Market Risk: When the Whole Market Sinks, So Does Your ETF
Many ETFs follow a market index or sector. That’s great when things are going up—but if the market takes a dive, your ETF goes with it. Buying an S&P 500 ETF, for example, means you’re tied to the performance of the 500 largest U.S. companies. If the economy slows down, inflation spikes, or investor confidence tanks, expect your ETF’s value to drop too. Diversification helps spread risk, but it doesn’t erase it.
Liquidity Risk: Some ETFs Are Harder to Trade Than Others
Not all ETFs are created equal when it comes to trading volume. The big ones—like SPY or QQQ—trade millions of shares a day. But niche or thematic ETFs that focus on very specific industries or trends may barely move on some days. That’s a problem if you want to buy or sell fast, and it is also a problem for traders who want to use ETFs for day trading and aim to profit from small intraday movements. Thin trading volume can also lead to wider bid-ask spreads, meaning you might pay more or sell for less than you expected.
True Diversification vs. Apparent Diversification
It’s easy to assume that owning multiple ETFs gives you more protection. And while that’s true to a point, it can backfire. A lot of ETFs hold the same popular stocks—Apple, Microsoft, Amazon, Google—so buying five different ETFs might just mean you’re stacking up on the same names over and over. You think you’re diversified, but you’re still heavily exposed to the same companies. In order to achieve a higher degree of diversification, you need to be mindful when you decide which ETFs to invest in.
Hidden Costs: Beyond the Expense Ratio
ETFs are known for low fees, but there are other costs people forget. The bid-ask spread—the difference between what buyers are willing to pay and what sellers want—can eat into returns, especially with lower-volume ETFs. And then there’s the riskier side of the ETF world: leveraged ETFs. These are designed to multiply daily gains (or losses), and while they might look exciting, they’re volatile, expensive, and not meant for long-term holding.
How to Choose the Right ETF: A Practical Checklist
ETFs can make investing simple—but picking the right one? That takes a little thought. With thousands of ETFs out there, it’s easy to get overwhelmed or distracted by flashy names and trending themes. The good news? You don’t need to be a finance pro to make a smart pick. You just need to ask the right questions.
Here’s a straightforward checklist to help you cut through the noise and choose an ETF that actually fits your goals.
What Does the ETF Track?
Every ETF is built around something—an index, sector, trend, or group of assets. Start by looking at what the ETF is following. Is it a broad market index like the S&P 500? A specific industry like tech or healthcare? Or something more niche, like artificial intelligence or renewable energy?
If you’re aiming for long-term growth, broad market ETFs might be your go-to. If you want to play a specific trend, thematic ETFs could be worth a look. Just make sure the theme matches your market analysis and your risk tolerance.
How Much Does It Cost to Own?
Expense ratios are the ongoing fees you pay to keep the ETF in your portfolio. Lower is better, since each penny you pay in fees is a penny you can not invest and that will not give any returns for you. Always check the ratio before you buy. If it’s high, there better be a really good reason. Make sure the higher fee is really worth it in terms of growth compared to similar ETFs with lower fees.
Most of the well-known ETFs from major issuers have expense ratios under 0.20%. Some go as low as 0.03%. That difference may not sound like a big deal, but over time, higher fees eat into your returns—especially if you’re investing for the long haul. An ETF having an unusually high fee that is not made up for in returns can also make the fund shares less attractive on the share market.
Who’s Behind the ETF?
It is generally considered safer to stock with well-known issuers with a good track record. Big names like Vanguard, iShares (by BlackRock), and SPDR (by State Street) are known for reliability and solid fund management. If you’re looking at an ETF from a company you’ve never heard of, dig deeper before you make any decision. What’s their track record? Are they well-regarded in the investing world?
Trust matters when your money’s on the line.
Note: Since ETFs are listed on an exchange, you will get some additional safety. A reputable exchange will require a lot of paper work before any fund is permitted to be listed, and there are also ongoing requirements that must be fulfilled for the fund to stay listed.
What’s the Performance History?
Past performance isn’t everything—but it is something. Look at how the ETF has performed over the last 1, 3, and 5 years. Compare it to similar ETFs or its underlying index. Is it doing what it’s supposed to do? Does it move how you’d expect based on market conditions?
Don’t chase past returns, but do pay attention to consistency. Past returns do not guarantee future performances, but they can be an indication.
Does It Match Your Strategy?
Finally, ask yourself what you actually want from this investment. Are you looking for growth over the next 10–20 years? Steady income through dividends? Short-term exposure to a specific sector? Something to hedge against risk? Make sure the ETF lines up with your time horizon, risk tolerance, and overall plan. If you’re building a core portfolio, a volatile niche ETF probably isn’t the best fit. If you’re trying to add some spice to an otherwise boring setup, then maybe it is.
Tips for ETF Investors: How to Build Smarter, Stronger Portfolios
ETFs make it easy to start investing—but if you want to go from “just getting started” to building real wealth, it pays to be strategic. A few smart moves (and a few things to avoid) can help you get more out of every dollar you invest.
Here are some no-nonsense tips for making ETFs work harder for you.
Start With Broad ETFs First If you’re new to investing, don’t overthink it—begin with a broad-market ETF like VTI (which tracks the total U.S. stock market) or VOO (which tracks the S&P 500). These give you instant exposure to hundreds of companies across different sectors, all in one purchase. They’re low-cost, time-tested, and take the guesswork out of “what stock should I buy?”
Once you’ve built a solid foundation, then you can explore sector-specific or thematic ETFs if you want to add some variety.
Reinvest Dividends Automatically
If your ETF pays dividends, don’t just let the cash sit in your account. Turn on DRIP (Dividend Reinvestment Plan) through your broker if available. This automatically reinvests dividends back into more shares of the ETF, helping you build wealth through compounding over time.
Even small dividend payouts add up when you reinvest consistently—especially if you’re holding long-term.
Don’t Chase Hype
It’s tempting to jump into the latest hot ETF—AI, space, blockchain, you name it. But unless you’ve done the homework and believe in the long-term trend, be cautious. A lot of these niche funds are built to attract attention, not necessarily deliver returns.
Avoid investing just because something is trending online or had a big one-month return. FOMO is not a strategy.
Watch Out for Portfolio Overlap
It’s easy to think you’re diversified because you own several different ETFs—but many of them may hold the exact same companies. For example, if you own a tech ETF, an S&P 500 ETF, and a growth ETF, you probably have a lot of exposure to Apple, Microsoft, Amazon, and Google. Check the top holdings of your ETFs, and make sure you’re not unintentionally doubling or tripling your bets on the same names when you´re seeking a higher degree of diversification.
How to Invest in ETFs
Open a Brokerage Account: ETFs are bought and sold like stocks, so you’ll need a brokerage account. Many online brokers offer ETFs, and some even provide commission-free ETFs.
Choose Your ETF: Determine what you’re looking to invest in—whether it’s a broad market index, a specific sector, or a global economy. Consider the ETF’s expense ratio, liquidity, and performance relative to its benchmark.
Monitor and Rebalance: Once you’ve invested in an ETF, it’s important to periodically review its performance. You may need to rebalance your portfolio if your allocations shift over time.
Bond Exchange-Traded Funds (ETFs) are specialized financial instruments that enable investors to track the performance of a specific bond index. By offering exposure to a diversified basket of bonds, bond ETFs present a convenient way to engage with the bond market. Unlike individual bonds, which are bought and sold in over-the-counter markets and can be less liquid, ETFs trade on stock exchanges, and their prices fluctuate throughout the trading day much like stocks.
Benefits of Bond ETFs
Investing in bond ETFs comes with several advantages. One of the primary benefits is liquidity. ETFs can be bought and sold throughout the trading day at market prices, providing a level of flexibility that individual bonds typically do not offer. This liquidity enables investors to easily enter or exit positions as market conditions change, without incurring substantial price deviations.
Another significant advantage is diversification. Bond ETFs hold a broad array of bonds within a single fund, spreading the investment risk across multiple issuers and sectors. This diversified exposure reduces the impact that the default or underperformance of a single bond can have on an investor’s portfolio.
Moreover, bond ETFs generally entail lower costs. They reduce the transaction fees associated with purchasing individual bonds, as trading bond ETFs usually incurs brokers’ fees which are typically lower. Additionally, management fees for ETFs are often less than those for traditional mutual funds.
Types of Bond ETFs
Bond ETFs come in various types, each catering to different investment goals and risk considerations:
Government Bond ETFs: These ETFs invest in bonds issued by governments, typically considered low-risk investments due to the backing of sovereign nations. They are often used by investors seeking stability or a relatively safe haven in volatile markets.
Corporate Bond ETFs: These include bonds issued by private and public corporations. While they tend to offer higher returns compared to government bonds, they also carry more risk, as they depend on the financial health of the issuing corporation.
Municipal Bond ETFs: These focus on bonds issued by municipal governments. Often providing tax advantages, they can be appealing for investors in higher tax brackets seeking tax-efficient income generation.
Strategies for Trading Bond ETFs in Shifting Markets
Strategic trading is crucial, especially in volatile market conditions. A variety of strategies can be deployed to make effective trading decisions:
Analyzing Economic Indicators
Successful trading of bond ETFs requires a keen understanding of macroeconomic indicators, such as interest rates, inflation, and employment figures. These indicators have a direct impact on bond prices and yields. For instance, an anticipated increase in interest rates could lead to a decrease in bond prices. Monitoring these dynamics allows investors to adjust their strategies accordingly and make data-driven decisions.
Utilizing Technical Analysis
Technical analysis is another critical tool for investors trading bond ETFs. By examining price charts and identifying patterns, investors can forecast future price movements. Technical indicators such as moving averages, relative strength index (RSI), and MACD (Moving Average Convergence Divergence) can offer insights into potential entry and exit points. This approach enables traders to capitalize on market trends and reversals in a timely manner.
Assessing Interest Rate Forecasts
Interest rates exert a strong influence on bond markets, as they affect the yields available on new bonds. Typically, when interest rates rise, existing bonds with lower yields become less attractive, causing their prices to fall. Conversely, declining interest rates generally boost bond prices. By keeping a close eye on central bank announcements and economic forecasts, investors can anticipate shifts in the bond market and adjust their holdings in bond ETFs accordingly.
Risk Management
Stringent risk management practices are essential when trading bond ETFs, as they help protect investments from adverse market conditions:
Setting Stop-Loss Orders
A stop-loss order is an automatic directive that triggers the sale of a security when it hits a pre-defined price, thus limiting potential losses. By setting stop-loss orders, investors can safeguard their portfolios against unexpected market downturns, ensuring that losses do not spiral out of control.
Diversification
Diversifying within bond investments further, investors can spread risk across different types of bond ETFs, mitigating risks associated with specific sectors or issuers. This strategy ensures that negative performance in one part of the portfolio can be balanced by gains in another, thus enhancing overall stability.
Monitoring Economic Conditions
Regularly reviewing and analyzing economic conditions is vital for investors involved in bond ETF trading. Changes in fiscal policy, geo-political events, and changes in global market dynamics can all impact bond markets. Being vigilant and proactive allows investors to make timely adjustments to their investment strategies, optimizing their portfolios’ performance in response to new information.
Conclusion
Trading bond ETFs, particularly in shifting market landscapes, demands a comprehensive understanding of both macroeconomic factors and the specific characteristics of the securities involved. Employing a combination of economic analysis, technical indicators, and robust risk management strategies enables investors to navigate the complexities inherent in the bond market. For those seeking additional resources and expert insights, several platforms offer detailed analyses and personalized guidance tailored to bond ETF investments. Whether one is a novice or a seasoned investor, staying informed is the cornerstone of success in bond ETF trading.
Index Exchange-Traded Funds (ETFs) have grown to be a cornerstone of the modern investment landscape, providing investors with a method to track and replicate the performance of specific indices, such as the S&P 500 or the Nasdaq 100. Like individual stocks, these funds are traded on stock exchanges. However, the intricacies of their operation, advantages, and inherent risks must be understood before one begins trading them. This article aims to delve deeper into these aspects to give a thorough overview of index ETFs.
The Basic Structure of Index ETFs
Index ETFs are designed to mirror the performance of an entire index. This structured approach allows investors to gain exposure to numerous securities without needing to purchase each stock within an index individually. Imagine it as buying a miniature version of the index, which needs precise management to ensure the ETF’s performance stays aligned with its intended benchmark.
Index funds are often composed of the same securities present in the indices they aim to replicate. The fund manager makes periodic adjustments to reflect changes in the index, such as when stocks are added or removed. Tracking Error is a critical concept to understand, as it measures how closely an ETF follows its index. A minimal tracking error indicates that the ETF effectively replicates the index’s performance.
Benefits of Trading Index ETFs
The growing popularity of these ETFs can be attributed to several significant benefits they offer investors.
Diversification
One of the most revered advantages is diversification. By owning an ETF, investors have access to an entire basket of securities, which reduces the risk associated with investing in a single company. This broad exposure can safeguard against volatility, as losses in some stocks could be offset by gains in others within the same index.
Liquidity
Index ETFs offer high liquidity because they are traded on major stock exchanges. This means investors can buy and sell these funds with ease, at market prices, during trading hours. Liquidity is essential as it ensures investors can enter or exit positions without significant price disruptions.
Cost-Efficiency
Compared to mutual funds, index ETFs are known for their lower cost structure. Since they are passively managed, they incur fewer management fees, making them an attractive option for cost-conscious investors. Additionally, because they trade like stocks, investors can avoid the potential redemption fees sometimes associated with mutual funds.
Establish a Trading Routine
For investors keen on diving into the world of index ETFs, establishing a disciplined routine is paramount. A well-structured trading routine supports informed and consistent decision-making, ultimately leading to more favorable trading outcomes.
Research and Analysis
The cornerstone of any trading routine is in-depth research and analysis. Dedicate time to secure a firm understanding of the indices you’re interested in. Scrutinize historical performance, trends, and future forecasts extensively. Capitalize on comprehensive financial news portals and platforms that offer up-to-date market data and analyst opinions.
Set Clear Trading Hours
With stock exchanges having specific operating hours, aligning your trading activities with these hours is essential. Understanding when markets open and close allows you to strategize efficiently. Being aware of your local time zone differences can also be crucial, especially when dealing with international indices.
Establish Risk Management Rules
Understand the importance of risk management to protect your investments. Set clear guidelines about the capital you are willing to risk on individual trades. Employ tools like stop-loss orders to restrain potential losses, ensuring you stay within the safety confines of your established risk tolerance.
Choosing the Right Trading Platform
The trading platform you opt for can profoundly affect your trading experience and success.
Platform Advantages
Select platforms that boast ease of use, robust analytical tools, and competitive transaction fees. Ensure the platform provides access to the ETFs you’re interested in and aligns with your trading approach regarding features and support.
Demo Accounts
Before diving into real-money trading, utilize demo accounts offered by many platforms. Practicing with virtual funds in a risk-free setting helps build confidence and effectiveness in your strategy without facing real financial repercussions.
Building a Robust Trading Strategy
Crafting a detailed and actionable trading strategy is indispensable for consistent profitability.
Technical Analysis
Technical analysis involves using statistical tools and models to predict future market movements based on historical data. Tools like the Moving Average (MA), Relative Strength Index (RSI), and Moving Average Convergence Divergence (MACD) are instrumental in evaluating trends and devising entry and exit strategies.
Fundamental Analysis
While technical analysis provides insight based on market patterns, fundamental analysis offers a broader perspective by considering economic indicators, news reports, central bank pronouncements, and geopolitical climates. Understanding these factors can provide a clearer picture of larger market shifts.
Monitoring and Adjustment
Trading isn’t a set-it-and-forget-it endeavor; regular monitoring and adjustments are crucial.
Evaluating Performance
Analyze your trading results periodically. Record which strategies work and which ones don’t, determining where they can be improved. By keeping track of performance metrics, you can tweak your strategy to optimize outcomes over time.
Commitment to Continuous Learning
Remaining abreast of current trends, technologies, and market strategies is key to sustained success. Engage in continuous education through diverse methods. Webinars, financial literature, and exchanges with other traders can illuminate new concepts and signal emerging opportunities.
In conclusion, trading index ETFs requires a prudent combination of research, strategy, and discipline. By developing a structured trading plan and committing to continuous improvement, traders can effectively harness the opportunities presented by these financial instruments. Through disciplined research and consistent routine, the journey of trading index ETFs can be both rewarding and educational.
Sector rotation is a strategic approach employed by investors to enhance portfolio performance by reallocating assets among different sectors of the economy. This investment strategy revolves around anticipating which sectors are likely to outperform others during the various phases of the economic cycle. By capitalizing on these predictable patterns, investors aim to improve their returns while minimizing risks.
Why Use ETFs for Sector Rotation?
Exchange-Traded Funds (ETFs) serve as optimal instruments for executing a sector rotation strategy. Their inherent diversification means that an investor does not need to rely on the performance of a single company. Instead, ETFs offer exposure to a broad array of companies within a specific sector, thereby distributing risk. Moreover, ETFs provide liquidity, allowing investors to buy and sell easily in the market. The cost-effectiveness of ETFs further adds to their appeal, as they often have lower management fees compared to mutual funds.
ETFs are especially convenient for facilitating transitions from one sector to another, thanks to the abundance of sector-specific options available. Investors can swiftly adjust their portfolios in response to changing economic conditions, taking advantage of shifting sector performances.
Economic Cycles and Sector Performance
Understanding how different sectors perform throughout the economic cycle is a fundamental aspect of sector rotation. The economic cycle itself consists of several phases, each characterized by varying levels of growth, contraction, and recovery.
Expansion: This phase is marked by rising economic activity and increased consumer confidence. During periods of economic expansion, sectors such as consumer discretionary and technology tend to outperform. Consumer discretionary companies benefit from increased consumer spending on non-essential goods, while technology firms often receive more business investments aimed at innovation and efficiency.
Peak: At the peak of the economic cycle, demand for raw materials often rises, bolstering sectors like energy and basic materials. Higher commodity prices during this time can lead to increased revenues for companies operating within these sectors.
Contraction: Economic downturns, or contractions, often prompt investors to seek refuge in defensive sectors. Sectors such as healthcare and utilities, which provide essential goods and services, typically exhibit resilience during these periods, maintaining steady performance even as other areas of the market falter.
Trough: As the economy begins to recover from a downturn, financials and industrials might see a resurgence. This renewed growth phase is characterized by increased capital expenditure, benefiting sectors that are integral to economic rebuilding and expansion.
Implementing Sector Rotation with ETFs
Implementing a successful sector rotation strategy using ETFs involves a series of calculated steps. The key to success lies in accurately identifying the current phase of the economic cycle and choosing the appropriate sector-specific ETFs.
Step 1: Identify the Current Economic Phase
The first step in implementing this strategy is to assess the current economic landscape. Investors can turn to key economic indicators like GDP growth rates, unemployment statistics, and measures of inflation to gauge the prevailing conditions. Regularly reviewing reports and data from reputable government agencies and financial news outlets can provide valuable insights into the current economic phase.
Step 2: Select Sector-Specific ETFs
Upon identifying the economic phase, the next step is selecting the corresponding sector-specific ETFs. For instance, in times of expansion, ETFs tracking consumer discretionary or technology sectors might be considered. Investors have access to a multitude of sector-specific ETFs provided by prominent financial institutions, such as the Vanguard and SPDR series. These offerings allow investors to tailor their selections based on personal preferences and investment goals.
Step 3: Monitor and Adjust
A dynamic sector rotation strategy requires regular monitoring and adjustment of the portfolio. Economic conditions are subject to change, and shifts in market environments demand timely responses. Investors should consistently review their holdings to align with emerging opportunities and mitigate risks associated with underperforming sectors. Taking a proactive approach to portfolio management is essential to the success of a sector rotation strategy.
Considerations and Risks
While sector rotation holds promise, it is essential to recognize the risks associated with this investment approach. Accurately predicting the phases of economic cycles poses a challenge, and mistimed trades can result in substantial losses. Additionally, frequent portfolio adjustments may incur transaction fees and tax implications, impacting overall profitability.
Diversification beyond sector rotation can offer added stability, as relying solely on this strategy may expose investors to greater fluctuations. The inherent unpredictability of markets underscores the importance of maintaining a balanced investment approach that accounts for a range of potential scenarios.
For investors seeking personalized guidance, consulting a professional financial advisor is advisable. Such experts can offer tailored advice based on individual financial situations and objectives. Further resources and comprehensive insights into sector rotation strategies are available through reputable financial services and investment firms, aiding investors in making informed decisions.
In conclusion, sector rotation leverages the cyclical nature of the economy to enhance investment returns. By understanding economic cycles and utilizing ETFs, investors can effectively implement this strategy. However, it is crucial to remain vigilant, considering the potential risks and opportunities that accompany sector rotation.
Volume is a critical factor in analyzing the movements of Exchange-Traded Funds (ETFs). It provides valuable insights into the strength and conviction behind a price movement. Understanding how to use volume effectively can assist traders in making informed decisions.
What is Trading Volume?
Trading volume refers to the total number of shares of a particular financial asset, such as an ETF, that are bought and sold over a specific period, typically a day. High volume often indicates robust interest and significant participation in that asset, while low volume implies less interest and engagement from market participants. This information is invaluable for traders who are interested in understanding the liquidity and volatility of an ETF, both of which are influenced by trading volume.
Importance of Volume in ETF Analysis
Volume plays a crucial role when confirming ETF moves and understanding market psychology. Here’s why it matters:
Confirming Price Trends: A price move accompanied by high volume suggests that the move has strong backing. This alignment between price and volume indicates genuine interest, making the trend more likely to be sustained. For example, in the case of an uptick in an ETF’s price, if the increase is driven by high volume, it is more likely to signify an ongoing and potentially long-lasting uptrend. Conversely, a downtrend on high volume might signal the continuation or acceleration of declining prices, suggesting that bearish sentiment is strong among traders.
Identifying Reversals: Significant changes in trading volume can hint at potential market reversals. A sudden spike in volume with little corresponding price movement might suggest that buyers or sellers are gaining strength, potentially leading to a trend reversal. When traders notice such anomalies, it often prompts further investigation into whether the underlying reasons could trigger a change in the current trend.
Validating Breakouts: Volume is often used to confirm breakouts from established price levels or ranges. A breakout from a defined trading range, accompanied by significant volume, suggests a higher probability of a genuine price movement as opposed to a false breakout that might lack the backing of substantial trading activity. This can be particularly relevant when an ETF breaches its historical support or resistance levels, indicating a possible shift in trend direction.
Analyzing Volume Indicators
To effectively use volume in ETF analysis, traders should consider various volume indicators, each offering distinct insights that can enhance the depth of analysis:
On-Balance Volume (OBV)
The On-Balance Volume (OBV) indicator assesses buying and selling pressure by adding the day’s volume when the price closes higher and subtracting it when the price closes lower. An increasing OBV suggests stronger buying pressure, while a decreasing OBV signals mounting selling pressure. Using OBV in conjunction with price trends allows traders to validate or question the legitimacy of price movements. For instance, if prices rise while OBV declines, it may indicate a weak rally that could lack sustainability.
Volume Moving Average
Calculating a moving average of volume helps smooth out day-to-day fluctuations and provides clearer insights into longer-term volume trends. Monitoring sudden increases or decreases in volume compared against the moving average can serve as a signal of changing trader sentiment. Such shifts might precede broader price changes and provide early alerts to traders regarding possible future price adjustments.
Practical Application
When analyzing ETFs, integrating volume data with other technical analysis tools could yield more robust insights. For instance, observing high volume at traditional support or resistance levels can reinforce these zones as crucial decision points for traders. This integration of volume data with price level considerations can help confirm market sentiment — whether traders are likely to hold the line or bring about a price breach. Moreover, coupling volume analysis with pattern recognition, such as triangles, flags, or head and shoulders, can offer traders an enriched analysis framework, providing multiple confirmation points before executing trades.
Conclusion
Volume is a vital metric for traders aiming to confirm ETF moves. It aids in identifying price trends, pinpointing potential reversals, and authenticating breakouts, thus enhancing the reliability and precision of trading strategies. Traders are encouraged to integrate volume analysis into a broader analytical approach, combining it with other technical and fundamental factors to gain a comprehensive view of market dynamics. By doing so, traders can better understand the context of volume changes within larger market trends, empowering them to make more informed and effective trading decisions.
For further reading on ETF trading strategies, exploring resources from financial education platforms and perusing market analysis articles from established financial news outlets could offer additional insights and deeper understanding about employing volume effectively.
By understanding and leveraging the power of volume, traders can enhance their market analysis and potentially increase the accuracy of their trading forecasts, ultimately leading to more successful investment outcomes.
Moving averages are crucial tools in the realm of Exchange Traded Fund (ETF) trading. They help traders identify trends by smoothing out price data. This technique involves calculating the average price of an asset over a specified number of periods, providing insight into the overall market direction.
Types of Moving Averages
In ETF trading, the most commonly used moving averages are the Simple Moving Average (SMA) and the Exponential Moving Average (EMA). These indicators play a pivotal role in enhancing traders’ abilities to discern market trends and make informed decisions.
Simple Moving Average (SMA)
The Simple Moving Average is calculated by summing up the closing prices of an asset over a defined period and then dividing this total by the number of periods considered. For instance, if a trader wants to calculate a 10-day SMA, they would add the closing prices of the past 10 days and then divide by 10. This method, though straightforward, provides useful insights into the asset’s price movements over time. The primary drawback of the SMA is its sensitivity to sudden spikes or drops in price, which can substantially impact the average and mislead trend identification.
Exponential Moving Average (EMA)
The Exponential Moving Average, alternatively, gives more weightage to recent prices, making it more adept at picking up new market information. The calculation of EMA is slightly more complex than that of the SMA, as it incorporates a multiplier to emphasize recent price behavior. Traders often favor EMA when they require a quicker reaction to price changes. While this is advantageous for timely trend identification, especially in rapidly changing markets, it may generate more false signals in environments characterized by high volatility.
Applying Moving Averages in ETF Trading
Moving averages can be employed in several ways to enhance ETF trading strategies. Key applications include trend identification, support and resistance levels, and moving average crossovers.
Trend Identification
A critical application of moving averages in ETF trading is trend identification. By superimposing moving averages on the ETF’s price chart, traders gain a broader perspective on whether the market is trending upward, downward, or moving sideways. Typically, when a moving average is angled upwards, it signals a potential uptrend, while a downward-sloping moving average indicates a potential downtrend. This visualization assists traders not only in recognizing the direction of the trend but also in anticipating potential reversals or continuations.
Support and Resistance Levels
Moving averages also play an instrumental role in determining support and resistance levels. If the price of an ETF descends to the level of the moving average, the moving average line may act as a support, a level where downward trends pause or rebound. Conversely, when the price climbs to the moving average line, it often acts as a resistance, a barrier preventing the price from rising further. Knowing these points equips traders with essential information to make timely buy or sell decisions, enhancing their trading precision.
Moving Average Crossovers
Among various strategies, moving average crossovers are widely observed by traders. This approach involves the interaction between two different moving averages with varying timeframes. A common scenario is observing a short-term moving average crossing above a long-term moving average, generating a bullish signal, suggesting a potential rise in price. In contrast, when a short-term moving average crosses below a long-term moving average, it emits a bearish signal, pointing to a possible decline. Crossovers thus serve as valuable indicators for traders looking to time their market entries and exits.
Choosing the Right Time Frames
When implementing moving averages in ETF trading, selecting the right time frames is paramount. Traders must match their trading horizon with the time frame of the moving averages they choose to apply. Short-term traders might lean towards moving averages based on shorter durations, such as 10 or 20 days, for increased responsiveness to price changes. Conversely, long-term investors might prefer using 50 or even 200-day moving averages for a more comprehensive view of the market trends. The choice of time frames can significantly affect the accuracy of trading signals, influencing traders’ success.
Conclusion
Incorporating moving averages into your ETF trading strategy can provide valuable insights into market trends and help identify potential entry and exit points. By offering a smoothed view of pricing data, moving averages allow traders to recognize underlying trends, momentum, and possible price reversals. However, it is crucial to combine these tools with other analytical methods to corroborate signals and minimize the risk of errors in trading decisions. While moving averages are powerful, relying solely on them may not suffice. Traders can enrich their strategies by exploring additional information from professional trading resources, such as Investopedia, or other educational content available on financial platforms. By doing so, they can gain a more rounded understanding of market dynamics and enhance their decision-making processes.
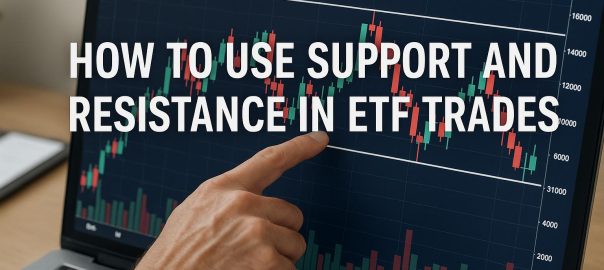
Understanding Support and Resistance in ETF Trading
Support and resistance are fundamental concepts in technical analysis, applied by traders to understand and predict price movements. When trading Exchange-Traded Funds (ETFs), these concepts can provide insights into potential buying and selling opportunities.
Defining Support and Resistance
Support is a price level where a downtrend can be expected to pause due to a concentration of demand or buying interest. It acts as a price floor where it is thought the asset’s price will not fall below. The reason behind this phenomenon is that, at this price level, buyers consider the asset to be undervalued and are more willing to buy it, which acts to stabilize the price or even push it higher.
Resistance is the opposite—a price level where a rising price tends to pause or reverse due to a concentration of selling interest. It is considered a price ceiling for the asset. Sellers view the asset as overpriced at this level and are more willing to sell it, causing upward momentum to slow down or reverse.
Using Support and Resistance in ETF Trading
To effectively use support and resistance in ETF trading, traders analyze the price charts of the ETF to identify these levels.
Identifying Support and Resistance Levels
To effectively identify support and resistance levels, traders start by examining historical price charts of the ETF to identify past levels where prices have consistently reversed or stalled. These points mark significant psychological levels among investors. It’s important to note how often and how recently these levels have been tested—levels that have been tested multiple times over time are generally considered stronger and more significant. Also, look for convergences where support or resistance lines intersect with other technical analysis tools or indicators, as these points may indicate particularly strong levels.
Trendlines and Channels
Traders often use trendlines to connect a series of highs or lows, helping to identify the overall direction of the ETF. These lines provide a visual representation of the trend direction and strength. Trendlines can intersect with levels of support and resistance, which can be especially useful for predicting potential breakout points or reversals.
Channels can also be drawn on the chart by drawing parallel lines representing both support and resistance. These channels can help define the upper and lower limits of an ETF’s price movement during a trend, offering insights into potential entry and exit points.
Strategies for Trading ETFs Using Support and Resistance
When deploying strategies using support and resistance, traders are leveraging a foundational concept of technical analysis to make more informed trading decisions.
Buying at Support
When the price of the ETF approaches a support level, traders may consider buying, anticipating that the price will bounce back from this level. This strategy involves watching for signs of price stabilization or reversal at the support level before entering a trade. For traders, timing the buy near the support level can optimize potential gains while minimizing risk.
Examples of Buying at Support
For instance, suppose an ETF historically doesn’t fall below a certain price level, showing strong buyer support. If the ETF approaches this level, traders might view it as an opportunity to enter the market, expecting a rebound. This scenario might prompt traders to place orders slightly above the support level, ensuring their orders are filled before an increase occurs.
Selling at Resistance
Conversely, as the price nears a resistance level, traders might sell or short the ETF, expecting the price to fall back after hitting this ceiling. This involves looking for signs that upward momentum is stalling or reversing after the ETF touches the resistance level. Traders often place sell orders a bit below the resistance level to ensure execution before potential pullbacks.
Examples of Selling at Resistance
Taking an example where an ETF repeatedly struggled to rise above a defined price, traders anticipate this level to hold. Selling near or slightly below this resistance level allows traders to capture gains and avoid potential declines should the ETF not break above this level.
Breakouts
A breakout occurs when the price moves through a support or resistance level. Traders can capitalize on this by buying if the price breaks through resistance, expecting it to continue rising, or selling if the price breaks through support. Successful breakouts often indicate a shift in market sentiment and the emergence of new trends.
Breakouts are more significant when confirmed by other technical indicators, such as increased volume or momentum. A breakout above resistance suggests strong buying pressure and potential for upward movement, while a break below support may signal continued bearish pressure.
Breakout Strategy Considerations
A breakout is typically more reliable when accompanied by a surge in volume, confirming increased market participation. Traders closely monitor the volume to judge the strength of breakouts, identifying whether the breakout reflects genuine market interest or may be a false signal that quickly retraces once the initial surge fades.
Importance of Volume
It’s crucial to consider volume when analyzing support and resistance. A breakout accompanied by high volume is typically seen as more significant and reliable than one with low volume. Higher trading volume often indicates more substantial interest in the ETF, making price movements more likely to continue in the breakout direction. In contrast, low-volume breakouts may suggest weaker conviction among traders and could lead to false breakouts or pullbacks.
Volume as a Confirmation Tool
Volume acts as a confirmation tool, validating price movements detected through support and resistance analysis. Traders observe volume trends to detect potential reversals or continuations of price trends. For instance, increasing volume during an attempt to break resistance strengthens the case for a successful breakout, whereas decreasing volume might signal lack of enthusiasm or a potential reversal.
Risks Involved
While support and resistance are powerful analytical tools, they are not foolproof. Various factors, including market volatility and external news, can cause prices to behave unpredictably. Traders should always use these techniques in conjunction with other indicators and carry out thorough analysis before making trades. External factors, such as geopolitical events or changes in economic policy, can significantly disrupt traditional support and resistance patterns.
Furthermore, back-testing strategies and monitoring market conditions are essential parts of a comprehensive trading plan. Considering a diversified approach and maintaining a risk management strategy can further help traders protect their portfolios from unforeseen market movements.
Finally, it is crucial for all traders to continue learning and adapting their strategies as market conditions evolve. For more strategies on ETF trading, you can explore resources from financial advisory websites and broker platforms such as Investopedia or major brokerage firms. These resources can provide additional insights into market trends, analysis tools, and advanced trading techniques.
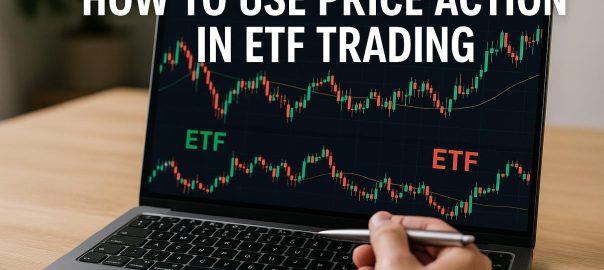
Price action is a trading technique that allows traders to read the market and make trading decisions based on recent and actual price movements, rather than relying solely on technical indicators. In the context of Exchange-Traded Funds (ETFs), price action can offer traders a pure and unambiguous method for understanding market behavior, providing insights into market dynamics without the clutter of overly complex tools.
The Basics of Price Action
Price action involves analyzing historical prices to predict future movements, placing emphasis on patterns and trends formed by individual price bars on charts. This method allows traders to interpret the story that the price movement is telling without external influences.
Candlestick Patterns: These are formations of the price movement within a specified time period. Each candlestick represents four crucial points: open, close, high, and low prices. Traders rely on classic candlestick patterns, such as the hammer or engulfing pattern, which serve as indicators of potential reversals or continuations within the market trends.
Support and Resistance Levels: These levels are crucial in price action analysis. Support is defined as a price level below which a security does not fall easily, providing a sort of “floor” for prices, while resistance is a level above which it does not rise, acting as a “ceiling.” These levels are instrumental in predicting possible price turning points, offering traders a strategic advantage in timing their transactions.
Applying Price Action in ETF Trading
To effectively use price action in ETF trading, traders must focus on understanding how current price movements can reflect potential future behavior. This understanding can significantly enhance trading performance in volatile environments where ETFs are often traded.
Trend Identification: Prior to making any trade, identifying the nature of the trend is essential. Determine whether the ETF is in an upward, downward, or sideways trend. This identification can help traders in selecting the appropriate trading strategy, adapting to the movement of the markets effectively.
Volatility Analysis: The level of market volatility is a critical factor in decision-making. Understanding volatility helps traders to set appropriate stop-loss levels. For instance, ETFs with higher volatility may require wider stop-losses to accommodate market fluctuations without prematurely closing profitable trades.
Strategic Decision Making
With price action analysis, traders focus on simple yet profound readings of the charts, allowing them to make informed decisions by considering both short-term and long-term trends. This strategic thinking can be pivotal in optimizing trading performance.
Entry and Exit Points: Determining the optimal points to enter or exit a trade is vital for maximizing returns. By using price patterns to identify high-probability trades, traders can increase the likelihood of successful transactions, making entry and exit strategies crucial components of effective trading.
Risk Management: Despite the valuable insights that price action analysis provides, incorporating sound risk management techniques is indispensable in trading. Use of stop-loss orders is critical in protecting against significant potential losses, ensuring that risk remains controlled and that financial exposure is minimized.
Continuous Improvement
Trading with price action is a skill that continually develops over time. Traders should engage in continuous market study and practice to hone their abilities and remain competitive. This commitment to learning ensures that they can adapt to evolving market conditions and methodologies, driven by real-time data rather than static historical analysis.
For more resources on price action in ETF trading, consider exploring expert trading platforms or financial advisory services. Online tutorials and courses can further guide you on utilizing price action effectively. Remember, while price action provides an insightful framework for understanding the markets, successful trading ultimately depends on disciplined execution and continuous learning, fostering a lifetime journey of growth and adaptation.
For additional insights on ETF trading strategies and market analysis tools, visiting reputable financial websites can provide a comprehensive overview. By integrating these tools and strategies, traders can harness price action as a cornerstone of their trading approach, leading to more informed and potentially successful trading outcomes.
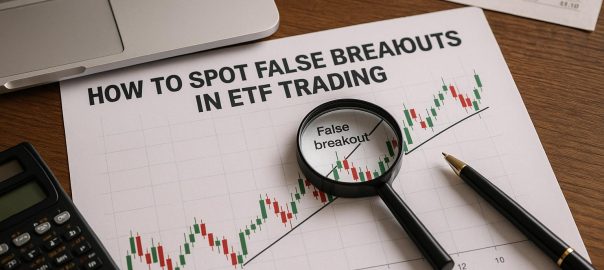
In the world of Exchange-Traded Funds (ETFs), the concept of breakouts is pivotal for traders looking to capitalize on significant price movements. A breakout occurs when the price of an ETF moves outside a defined level of support or resistance with increased volume. However, not all breakouts result in sustained price movements, leading to what is known as a false breakout. Understanding these phenomena is crucial for traders aiming to optimize their strategies and minimize potential losses.
Characteristics of False Breakouts
False breakouts can often mislead traders by giving the impression of a new trend when the market is merely reacting to short-term factors. Understanding the characteristics of false breakouts in ETF trading can help traders minimize losses and make more informed decisions.
Lack of Volume
A critical indicator of a breakout’s validity is trading volume. A true breakout is typically accompanied by a significant increase in volume, indicating strong market interest. In contrast, a false breakout may occur on low volume, suggesting that the move lacks the necessary momentum to sustain itself. Trading volume acts like a magnifying glass, bringing clarity to the intentions behind market movements. Without a notable rise in volume, the legitimacy of a breakout is often in question, leading traders to suspect a weaker commitment from the market participants.
Quick Reversal
Another hallmark of a false breakout is a quick reversal in price. After briefly moving beyond a resistance or support level, the price often retreats to its previous trading range if the breakout is false. This retracement may happen within just a few trading periods. The rapid reversal indicates that the breakout was not backed by strong consensus among traders, and the push beyond previous levels was likely unsustainable.
Market Context
The broader market context often gives clues about the sustainability of a breakout. If the overall market trend contradicts the breakout, there is a higher chance that it could be false. Traders should consider overarching market trends, macroeconomic indicators, and news events for comprehensive analysis. By aligning the breakout with the larger market sentiment, traders can assess whether the movement is part of a genuine market shift or merely a temporary anomaly.
Strategies to Spot False Breakouts
Identifying false breakouts involves a mix of technical analysis and strategic observation. Employing certain strategies can help traders reduce exposure to these deceptive movements.
Technical Indicators
Leveraging technical indicators can provide deeper insights into price movements. Tools such as the Relative Strength Index (RSI), Moving Average Convergence Divergence (MACD), and Bollinger Bands can be utilized to assess the strength of a breakout. For instance, if the RSI is reading overbought, it might indicate a weaker breakout. These indicators serve as supplementary tools that traders can employ alongside volume analysis to further validate or refute a breakout, providing a multi-faceted view of market conditions.
Confirmation with Time Frame Analysis
Using multiple time frames for analysis provides a more substantial confirmation of a breakout. If a price breakout is visible on a smaller time frame but not corroborated by broader time frames, it could suggest a false breakout. Observing price action over different time frames allows traders to discern short-term noise from long-term trends, thereby enhancing the accuracy of their breakout assessments.
Monitoring News and Events
Market reactions to news events can lead to short-lived breakouts. Traders should stay informed about relevant economic announcements and geopolitical events through reliable financial news sources to discern if a breakout is news-driven and likely to falter. The impact of news events can cause abrupt, temporary shifts in market sentiment, which may not always translate into long-term trends.
Conclusion
Spotting false breakouts in ETF trading requires a keen understanding of market behavior, the application of technical analysis, and the ability to contextualize market movements. By recognizing the signs of false breakouts, traders can improve their trading strategies and enhance their ability to navigate the ETF market with precision. For detailed insights into market dynamics and trading strategies, consider exploring specialized financial blogs and market analysis platforms like Investopedia.
Understanding and identifying false breakouts are critical skills for traders in the ETF market. Engaging with volume analysis, technical indicators, multi-time frame strategies, and news monitoring collectively contributes to a robust trading strategy. Traders can strive to minimize the impact of these misleading market movements by viewing breakouts not in isolation but within the broader context of market behavior and sentiment.
Moreover, continuous learning and adaptation to market conditions remain essential. The landscape of ETF trading is complex, and false breakouts represent just one of the many challenges traders face. By remaining informed and adaptable, traders can better equip themselves to manage uncertainties while seeking lucrative opportunities in the market.
Through experience, careful analysis, and strategic application of trading tools, market participants can gradually hone their ability to distinguish between genuine and false breakouts, ultimately refining their trading acumen and enhancing their success potential in the dynamic ETF market.
In the realm of financial markets, exchange-traded funds (ETFs) may sometimes exhibit a behavior known as range-bound. This particular aspect involves the movement of an ETF’s price within a defined span, characterized by a specific upper limit (resistance) and a lower bound (support), without any significant breakout either upward or downward. Understanding this distinctive behavior is pivotal for investors aiming to enhance their ability to capitalize on market movements effectively.
Identifying Range-Bound Markets
One of the primary steps in trading within such markets is the identification of range-bound behavior. These markets are characterized by clearly defined support and resistance levels formed by the highest and lowest prices over a specified period. The support level is the point where the demand is sufficiently robust to prevent further decline in price. In contrast, the resistance level is identified where selling pressure is strong enough to halt any further ascent in price. These levels are often discernible through charts via technical analysis tools, which investors frequently employ.
Key Tools and Indicators
For traders aiming to navigate range-bound markets, utilization of various technical analysis indicators is essential.
Bollinger Bands: A popular tool for measuring market volatility, Bollinger Bands aid in identifying overbought or oversold conditions within a given range. The bands widen with increasing volatility and contract when volatility decreases, signaling respective potential market opportunities.
Relative Strength Index (RSI): This oscillator measures the velocity and change of price movements, serving as an indicator of whether an ETF is overbought or oversold. RSI values above 70 typically signal overbought conditions, whereas values below 30 suggest oversold circumstances, guiding traders in making more informed decisions.
Moving Averages: Moving averages, quintessential tools in technical analysis, help smooth out price actions and assist in determining trend direction. In range-bound scenarios, moving averages are generally flat, reflecting the side-to-side price action common in such markets.
Strategies for Trading Range-Bound Markets
Once an investor successfully identifies a range-bound market, the next step involves employing specific strategies to benefit from the limited price fluctuation observed in such settings.
Buy at Support, Sell at Resistance: This straightforward strategy implies purchasing the ETF when approaching the support level and selling upon nearing the resistance level. This approach seeks to exploit predictable price movements within the established range.
Breakout Strategy: Despite the stability typically associated with range-bound markets, breakouts may occur, presenting potential opportunities. Traders often position themselves to capitalize on breakouts that surpass resistance or drop below support, typically accompanied by increased trading volume, indicating a potential new trend direction.
Use Stop-Loss Orders: Employing stop-loss orders becomes crucial to mitigate risks, especially in range-bound trading scenarios, where unforeseen breakouts might result in rapid price shifts. Stop-loss orders help limit potential losses by setting predefined points where trades will be automatically exited.
Risk Management
Thorough risk management is a cornerstone of trading within range-bound markets. Setting distinct entry and exit points, guided by technical indicators, is essential in managing trades proficiently. By implementing effective risk management strategies, traders can safeguard against significant losses while ensuring profits are secured when the market eventually experiences a breakout from its designated range.
Conclusion
Trading ETFs in range-bound markets represents a viable strategy, particularly when traders adopt disciplined risk management practices and effectively leverage technical indicators. Understanding the nuanced nature of range-bound movements, combined with the employment of suitable strategies, enables investors to potentially achieve consistent returns even in seemingly stagnant markets. As always, enhancing one’s knowledge through further reading and exploration of reputable financial resources, such as Investopedia, can provide invaluable insights into effective trading practices.
Exchange-Traded Funds (ETFs) have become an essential component of modern investment portfolios, offering a combination of liquidity and diversification. Among the various strategies that traders employ while dealing with ETFs, trading pullbacks stands out for its ability to capitalize on temporary price reversals. A pullback is a short-term reversal in the direction of an ETF’s price, occurring within a broader trend. This temporary shift presents traders with potential entry points at more favorable prices. To successfully trade pullbacks, one must have a keen understanding of market dynamics and impeccable timing.
Importance of Trend Identification
Trend identification is the foundation of trading pullbacks. Recognizing the prevailing direction of an ETF—be it upward, downward, or sideways—is critical in deciding when and how to trade. Traders often rely on technical analysis tools to discern trends. These tools include moving averages, which smooth out price data to reveal the direction of a trend, trendlines that connect highs and lows on a chart, and the Relative Strength Index (RSI), a momentum oscillator that measures the speed and change of price movements. By utilizing these tools, traders can ascertain whether they are following the trend’s direction, which often increases the likelihood of a successful trade.
Determining the Ideal Entry Point
Timing is of the essence when engaging in pullback trading of ETFs. It is essential to wait for confirmation that a pullback has concluded and that the trend is set to resume. Traders employ several methods to discern these turning points, such as analyzing candlestick patterns, evaluating support and resistance levels, and assessing trading volume.
For example, in an upward trend, waiting for a bullish reversal pattern confirmed by a surge in volume can be a signal of impending upward momentum. This approach helps traders avoid entering too early in anticipation of a trend that might not materialize. In contrast, during a downward trend, traders might seek bearish reversal patterns that suggest a continuation of the decline.
Utilizing Technical Indicators
Technical indicators provide additional insights into when a pullback might end and the broader trend continue. Here are some key indicators commonly utilized by traders:
Fibonacci Retracement: This tool is used to identify potential support and resistance levels by marking proportions of an asset’s prior move. Traders often seek buy entries at these retracement points, which might align with established trends.
Moving Averages: Whether it is the Simple Moving Average (SMA) or the Exponential Moving Average (EMA), these averages help traders determine dynamic support or resistance zones, reinforcing their entry and exit strategies.
Stochastic Oscillator: This momentum indicator compares a particular closing price of an ETF to a range of its prices over a certain period. It helps in assessing whether an ETF is overbought or oversold, aiding traders in identifying possible reversal points.
Risk Management
Risk management is paramount when trading pullbacks, even with accurately timed entries. Establishing a stop-loss order is a fundamental strategy to protect against significant losses if the trade does not proceed as anticipated. Aligning the stop-loss with key technical levels, like positioning it below a critical support level in an optimistic trade setup, can offer additional security. Furthermore, employing strategic position sizing can help ensure that no single trade has an outsized impact on your overall portfolio.
Staying Informed with Market News
Despite the invaluable insights provided by technical indicators, remaining informed about market news is also crucial. Economic data releases, geopolitical events, and corporate earnings calls can significantly influence ETF prices, leading to market volatility. By consistently monitoring these developments on financial platforms such as Bloomberg or CNBC, traders can discern whether a pullback stems from temporary influences or reflects a more significant structural alteration in market conditions.
Continuous Learning and Adaptation
ETF trading, like other market strategies, is not static. It continually evolves, necessitating a commitment to continuous learning and adaptation. Traders can hone their skills by reflecting on past trades, refining strategies based on previous outcomes, and drawing insights from experienced market practitioners. Resources such as online trading courses, webinars hosted by financial experts, and consultations with financial advisors can provide valuable knowledge and fresh perspectives.
In summation, effectively trading ETF pullbacks demands a balanced approach that weaves together technical analysis, astute market awareness, and disciplined risk oversight. By refining these competencies, traders can enhance their market timing and improve their chances of success in the ever-evolving domain of ETFs. As traders become more adept in these areas, they position themselves better to capitalize on the opportunities presented in the vibrant and dynamic world of ETF trading.